SHELDON LIU, 1223168
Contrast detectability is an essential on going quality assurance test that should be performed regularly to maintain consistent image quality. The contrast detectability is the ability to resolve different objects from the background when the difference in attenuation between the objects and the background is small compared to noise (SC35, 2008). According to Table 1 from Safety Code 35 (SC 35) (2008), threshold contrast detail detectability should be evaluated for acceptance testing for computed radiography and digital radiography.
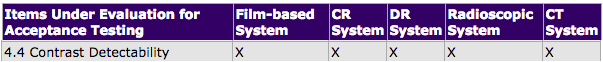
Table 1. Acceptance Testing for Radiological Equipment (SC 35, 2008).
The TOR RAD or TOR CDR used for this study was custom made for quick and easy routine test to check imaging performance (Figure 1). The manufacturer's recommended test procedures should be followed.
| Recommended Beam conditions: 70kVp with a primary filter of 1mm copper. CR Beam conditions used: 70kVp @ 10mAs, 1mm Cu DR Beam conditions used: 70kVp @ 6.3mAs, 1mm Cu 1mm Cu filter, combined with a high kVp, were used in order to decrease contrast from the phantom and increase noise. This results in a reduced SNR ratio, therefore easier for assessing low contrast resolution. | 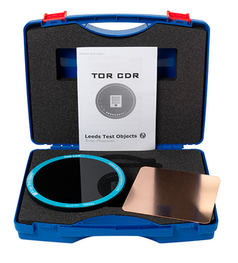 Figure 1. TOR RAD/CDR with 1mm Copper manufactured by Leeds Test Object Ltd. |
Measuring the low-contrast sensitivity involves analyzing the test tool by means of counting the number of large circular details (11mm) against the background. The number of resolved circular details corresponds to a threshold contrast that can be found from Table 2. It may be necessary to view more than one sample image and find a mean value (Leeds Test Object Ltd, n.d.). Therefore, in order to maintain consistency, two subsequent exposures are taken under the same conditions.
The high-contrast sensitivity is measured by counting the number of small circular details (0.5mm). These details are more difficult to detect and greatly influenced by the noise present in the image. The threshold contrast value can be found from Table 2.
The high-contrast sensitivity is measured by counting the number of small circular details (0.5mm). These details are more difficult to detect and greatly influenced by the noise present in the image. The threshold contrast value can be found from Table 2.
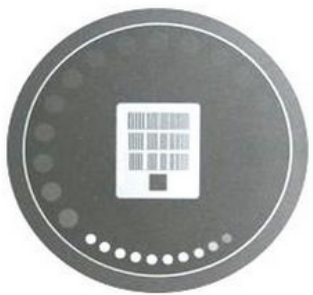 Figure 2. Processed image of Leeds Test Tool | 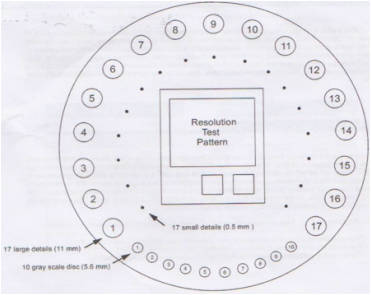 Figure 3. Layout of test details (not to scale) |
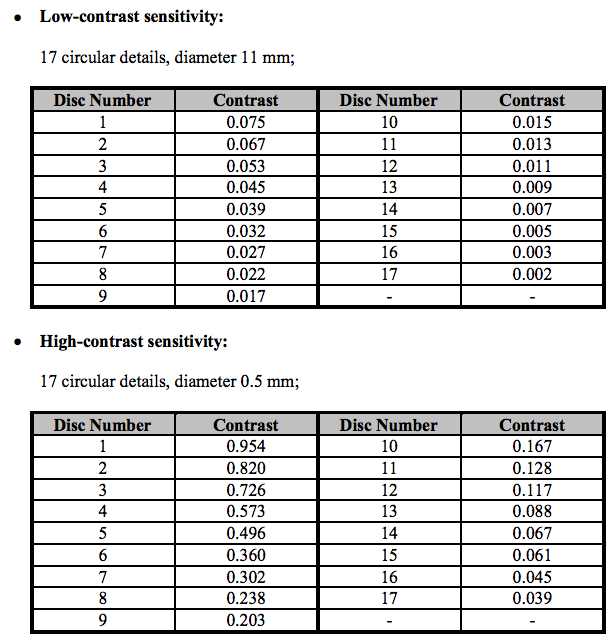
Table 2. Xray contrast values of Low and High sensitivity given for beam conditions of 70kVp with 1mm copper inherent filtration.
Results
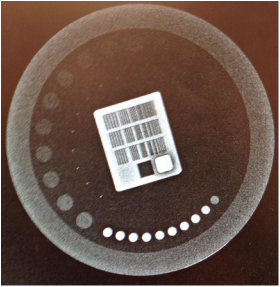 Figure 4. Leeds Test Tool for CR in Room 5 | 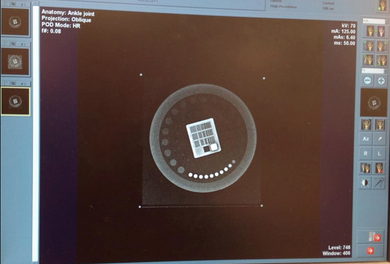 Figure 5. Leeds Test Tool for DR in Room 5 |
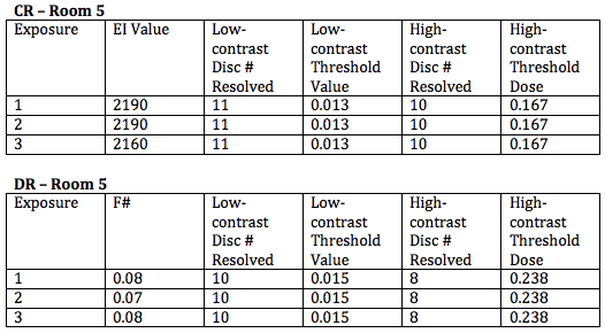
Table 3. Results for CR and DR taken in Room 5
The EI values remained consistent with only a difference in the third exposure. All images shared the same number of low disc numbers resolved, then the same number of high disc numbers resolved as seen in Table 3. Similarly DR followed the same pattern but with fewer disc number resolved for both low and high contrast. The corresponding threshold doses are compared and subject to manufacturing tolerances of +/- 5% (Leeds Test Object Ltd, n.d.). The average EI value of the three exposures is 2180, which falls under the optimal range (1800-2200). We could also consider the images with EI values close to 1800 and 2200, as lower and upper control limits respectively for contrast threshold dose. The f# for DR should fall between -1 and +1 for reasonably diagnostic quality images (AAPM, 2009). The higher the f# beyond +1 represents an over exposure, and values under -1 will be considered underexposed. It is also important to monitor trends and to prevent the issues as oppose to repairing the equipment, which could require time and money.
There is an inverse relationship between the number of discs resolved to the contrast threshold dose. Therefore the lower the contrast threshold, the increase in contrast sensitivity; ability to visualize grey on grey. For example, being able to differentiate between pancreatic mets from a regular pancreas, which share similar densities. Misdiagnosis, such as false positives and negatives, could also occur when unable to discern structures from one another due to low contrast detectability.
The decrease in contrast detectability can be caused by a number of factors. The cassette performance will determine the quality of the image, as well as the CR processor. For instance, if there is damage to the cassette or processor, it could decrease the number of resolvable discs. In DR, if the algorithms are off, the final image could lack in contrast. Since kVp is responsible for penetration and directly affects the contrast resolution, it is important to ensure kVp accuracy is up to standards.
The limitation to threshold contrast detail detectability is that it is subjective to the observer’s visual acuity, dependent on the quality of the monitor, and lighting conditions.
REFERENCES
Health Canada. (2008). Safety code 35: Safety procedures for the installation, use and
control of x-ray equipment in large medical radiological facilities.
Retrieved from http://www.hc-sc.gc.ca.
Leeds Test Objects Limited. (n.d.). Leeds test objects TOR CDR [PDF document]. Retrieved from
https://avenue.cllmcmaster.ca/d2l/le/content/145052/viewContent/1161504/View.
Report of AAPM Task Group 116. (2009). An Exposure Indicator for Digital Radiography. Retrieved from http://www.aapm.org/pubs/reports/rpt_116.pdf.
